Australian households experienced a break-in in 2024-25.
Around 540 a day, averaged across the year.
Source: ABS Crime Victimisation 2024-25Every figure on this page comes from a named public source — mostly the Australian Bureau of Statistics (ABS) Crime Victimisation survey — and links straight to it. No estimates of our own, no scare math.
Last reviewed: 8 July 2026 · Reference period: ABS 2024-25 release (with 2023-24 for comparison)
Around 540 a day, averaged across the year.
Source: ABS Crime Victimisation 2024-25Around 600 households a day had someone try.
Source: ABS Crime Victimisation 2024-25ABS reports 76% had one incident — the remainder were hit again.
Source: ABS Crime Victimisation 2024-25An attempt is often the first test of a property, not the last.
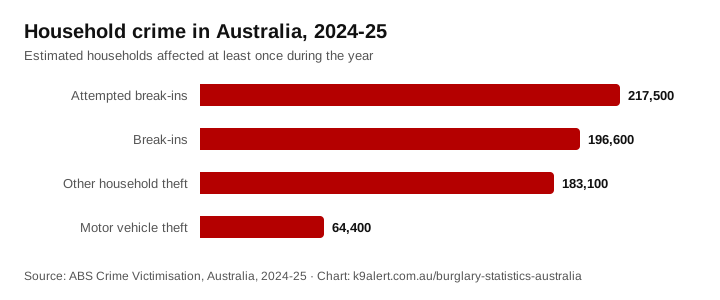
Source: ABS Crime Victimisation 2024-25Estimated Australian households experiencing each crime type at least once during 2024-25, as measured by the ABS Crime Victimisation survey.
| Crime type | Households affected (2024-25) |
|---|---|
| Attempted break-in | 217,500 |
| Break-in | 196,600 |
| Other household theft | 183,100 |
| Motor vehicle theft | 64,400 |
Attempted break-ins outnumber completed ones. In plain terms: more households heard or found the evidence of someone trying than actually lost entry — which is exactly the window where a deterrent still changes the outcome.
From the same ABS release, looking at each household's most recent break-in.
The costs stack: most victim households lose property, close to half also repair damage, and a small but real share come face to face with the offender. Victoria Police prevention guidance focuses on stopping the approach early — visible occupancy cues, secured entry points and layered deterrents — for precisely this reason. See the Victoria Police burglary prevention page for the full checklist.
Comparing the two most recent ABS releases. Lower is better — and one good year is direction, not destiny.
| Measure | 2023-24 | 2024-25 | Change |
|---|---|---|---|
| Households with a break-in | 217,600 | 196,600 | −21,000 |
| Households with an attempted break-in | 226,300 | 217,500 | −8,800 |
How to read this: the ABS Crime Victimisation figures are survey estimates of households affected, not police incident counts, so they capture crimes that never got reported. That makes them the better measure of what households actually experience — and it is why we use them here instead of recorded-crime tallies.
Citing this page: you are welcome to reference these figures with a link back to this page, or cite the ABS release directly — the primary source always wins. We review this page when each new ABS Crime Victimisation release is published (roughly annually). Spotted an error? Email support@k9alert.com.au and we will check it against the source.
Use this data
Suggested citation:
Australian Bureau of Statistics (2026), Crime Victimisation, Australia, 2024-25, summarised by K9-Alert: https://k9alert.com.au/burglary-statistics-australia/
Embed the chart:
<figure>
  <img src="https://k9alert.com.au/burglary-statistics-australia/household-crime-australia-2024-25.svg" width="720" height="300" alt="Household crime in Australia, 2024-25 (ABS)">
  <figcaption>Source: ABS Crime Victimisation 2024-25, via <a href="https://k9alert.com.au/burglary-statistics-australia/">K9-Alert break-in statistics</a></figcaption>
</figure>
Why we publish this: K9-Alert sells a $99.95 motion-triggered barking deterrent, so we track this data year-round for our own customers. The statistics above stand on their own — every claim links to the public source, and nothing here depends on taking our word for it. For the practical response to these numbers, start with the layered home security guide; if a deterrent layer is what you are after, the product range is one option among the layered steps police recommend.
The Australian Bureau of Statistics estimates 196,600 households experienced a break-in and 217,500 experienced an attempted break-in in 2024-25. Averaged across the year, that is roughly 540 completed break-ins and about 600 attempts per day.
Comparing the two most recent ABS releases, both measures fell: break-ins from an estimated 217,600 households in 2023-24 to 196,600 in 2024-25, and attempted break-ins from 226,300 to 217,500. A single year-on-year move is not a long-term trend, so treat this as direction, not destiny.
ABS 2024-25 data shows 76% of break-in victim households had one incident during the year, which means about 24% had more than one. Repeat targeting is why prevention advice focuses on fixing the entry point and adding a visible or audible deterrent quickly after a first incident.