
TL;DR: These QPS figures are monthly rates per 100,000 residents for September 2026, not annual rates. The searchable table keeps dwelling entry, unlawful use of a vehicle and vehicle-entry theft separate. Use it as local context; do not compare it directly with the annual NSW or Victoria tables or extrapolate a yearly total.

How is the Queensland crime rate by area measured?
QPS publishes reported-offence rates per 100,000 persons by local government area and month. The underlying rate relates reported offences to resident population, scaled to 100,000. This guide copies the September 2026 cells in the official LGA rates CSV; it does not calculate populations or annualise a monthly observation.
The CSV labels September 2026 as SEP26. The selected columns are Unlawful Entry With Intent - Dwelling, Unlawful Use of Motor Vehicle, and Vehicles (steal from/enter with intent). Those are the publisher’s category names. They should not be renamed as identical versions of another state’s offences just to make a comparison look simpler.
After the data check, inspect the approach to your parked vehicle using the wireless driveway alarm guide. The relevant questions are practical: whether the car can be approached unseen, whether a remote is left inside, and whether someone could move from parking to a sheltered door without being noticed.
The resident-population denominator excludes people temporarily visiting for work or holidays. The Queensland Government Statistician’s Office explains why visitor and transient populations can affect interpretation. The downloaded rates file does not specify a population vintage for every monthly cell, so we do not attach an unverified population year to it.
Which areas have the highest rates?
For the selected dwelling-entry category in September 2026, Doomadgee has the highest rate in this snapshot, followed by Palm Island and Yarrabah. That ordering applies only to one offence category in one month. It is not an official annual council comparison, a measure of all crime or a judgement about a community.
| LGA | Unlawful entry with intent - dwelling, monthly rate per 100,000 |
|---|---|
| Doomadgee Shire Council | 467.6 |
| Palm Island Shire Council | 209.3 |
| Yarrabah Shire Council | 149.0 |
| Carpentaria Shire Council | 131.9 |
| Cairns Regional Council | 123.1 |
This ordering includes small-population councils because the official file publishes their rates. A small change in the offence count can move a small council’s rate substantially. A single-month high value needs more context before informing a relocation, insurance or spending decision; it cannot establish a stable annual pattern.
The vehicle columns can give a different ordering from the dwelling-entry column. Avoid combining them into a single score: the categories describe different events, and the file provides no validated weighting for a home-security index. Check the original series over comparable periods if you need to understand whether an apparent difference persists.
Check your Queensland council
Search an LGA name to see the September 2026 monthly rates for the selected offence categories. Every area with a SEP26 row in the downloaded QPS file is included. Rates are displayed to one decimal place, and explicit zero values are retained. No unpublished monthly cell has been filled with an estimate.
Worked lookup: Brisbane City Council
Enter Brisbane below and select the Brisbane City Council row. Its dwelling-entry value is 27.3 per 100,000 residents for September 2026 only, rounded from the QPS LGA rates CSV. In the original file, match both LGA Name = Brisbane City Council and Month Year = SEP26 before reading Unlawful Entry With Intent - Dwelling.
Keep the month, category and council name with any saved result: this row does not describe every suburb individually or an entire year. For a trend, review a longer run of matching observations in the official series rather than multiplying this value or substituting the CSV file’s download date for its reporting month.
All 78 rows shown. All rows remain available without JavaScript.
| LGA | Dwelling entry: monthly rate per 100,000 | Unlawful use of motor vehicle: monthly rate per 100,000 | Vehicles (steal from/enter with intent): monthly rate per 100,000 | Period |
|---|---|---|---|---|
| Aurukun Shire Council | 85.3 | 0.0 | 0.0 | September 2026 only |
| Balonne Shire Council | 23.0 | 68.9 | 68.9 | September 2026 only |
| Banana Shire Council | 19.7 | 6.6 | 6.6 | September 2026 only |
| Barcaldine Regional Council | 33.7 | 33.7 | 67.5 | September 2026 only |
| Barcoo Shire Council | 0.0 | 0.0 | 0.0 | September 2026 only |
| Blackall-Tambo Regional Council | 0.0 | 0.0 | 0.0 | September 2026 only |
| Boulia Shire Council | 0.0 | 0.0 | 0.0 | September 2026 only |
| Brisbane City Council | 27.3 | 24.8 | 39.8 | September 2026 only |
| Bulloo Shire Council | 0.0 | 0.0 | 0.0 | September 2026 only |
| Bundaberg Regional Council | 14.7 | 16.6 | 26.7 | September 2026 only |
| Burdekin Shire Council | 52.0 | 5.8 | 17.3 | September 2026 only |
| Burke Shire Council | 0.0 | 220.2 | 0.0 | September 2026 only |
| Cairns Regional Council | 123.1 | 54.1 | 33.7 | September 2026 only |
| Carpentaria Shire Council | 131.9 | 0.0 | 87.9 | September 2026 only |
| Cassowary Coast Regional Council | 19.4 | 19.4 | 9.7 | September 2026 only |
| Central Highlands Regional Council | 10.1 | 10.1 | 33.7 | September 2026 only |
| Charters Towers Regional Council | 57.6 | 0.0 | 16.5 | September 2026 only |
| Cherbourg Shire Council | 0.0 | 153.4 | 0.0 | September 2026 only |
| Cloncurry Shire Council | 0.0 | 0.0 | 0.0 | September 2026 only |
| Cook Shire Council | 81.2 | 60.9 | 0.0 | September 2026 only |
| Croydon Shire Council | 0.0 | 0.0 | 0.0 | September 2026 only |
| Diamantina Shire Council | 0.0 | 0.0 | 0.0 | September 2026 only |
| Doomadgee Shire Council | 467.6 | 66.8 | 0.0 | September 2026 only |
| Douglas Shire Council | 37.6 | 7.5 | 0.0 | September 2026 only |
| Etheridge Shire Council | 0.0 | 136.4 | 136.4 | September 2026 only |
| Flinders Shire Council | 64.5 | 0.0 | 0.0 | September 2026 only |
| Fraser Coast Regional Council | 35.0 | 27.1 | 63.7 | September 2026 only |
| Gladstone Regional Council | 18.5 | 21.4 | 20.0 | September 2026 only |
| Gold Coast City Council | 14.1 | 19.1 | 37.2 | September 2026 only |
| Goondiwindi Regional Council | 38.4 | 57.6 | 38.4 | September 2026 only |
| Gympie Regional Council | 11.7 | 20.1 | 36.9 | September 2026 only |
| Hinchinbrook Shire Council | 8.9 | 8.9 | 8.9 | September 2026 only |
| Hope Vale Shire Council | 0.0 | 0.0 | 91.8 | September 2026 only |
| Ipswich City Council | 13.3 | 22.0 | 43.6 | September 2026 only |
| Isaac Regional Council | 12.9 | 21.5 | 34.5 | September 2026 only |
| Kowanyama Shire Council | 86.0 | 0.0 | 0.0 | September 2026 only |
| Livingstone Shire Council | 20.2 | 4.5 | 22.4 | September 2026 only |
| Lockhart River Shire Council | 0.0 | 278.4 | 0.0 | September 2026 only |
| Lockyer Valley Regional Council | 12.7 | 8.5 | 14.8 | September 2026 only |
| Logan City Council | 26.5 | 39.2 | 76.5 | September 2026 only |
| Longreach Regional Council | 80.3 | 53.5 | 26.8 | September 2026 only |
| Mackay Regional Council | 19.9 | 14.6 | 38.4 | September 2026 only |
| Mapoon Shire Council | 0.0 | 0.0 | 0.0 | September 2026 only |
| Maranoa Regional Council | 22.4 | 14.9 | 14.9 | September 2026 only |
| Mareeba Shire Council | 44.9 | 40.9 | 28.6 | September 2026 only |
| McKinlay Shire Council | 0.0 | 0.0 | 0.0 | September 2026 only |
| Moreton Bay City Council | 13.2 | 13.2 | 32.7 | September 2026 only |
| Mornington Shire Council | 90.0 | 90.0 | 0.0 | September 2026 only |
| Mount Isa City Council | 92.2 | 43.4 | 10.8 | September 2026 only |
| Murweh Shire Council | 0.0 | 49.8 | 0.0 | September 2026 only |
| Napranum Shire Council | 0.0 | 0.0 | 0.0 | September 2026 only |
| Noosa Shire Council | 11.6 | 13.3 | 16.6 | September 2026 only |
| North Burnett Regional Council | 18.7 | 9.4 | 18.7 | September 2026 only |
| Northern Peninsula Area Regional Council | 67.5 | 33.7 | 33.7 | September 2026 only |
| Palm Island Shire Council | 209.3 | 83.7 | 0.0 | September 2026 only |
| Paroo Shire Council | 0.0 | 0.0 | 0.0 | September 2026 only |
| Pormpuraaw Shire Council | 0.0 | 0.0 | 0.0 | September 2026 only |
| Quilpie Shire Council | 0.0 | 0.0 | 0.0 | September 2026 only |
| Redland City Council | 10.2 | 15.9 | 19.3 | September 2026 only |
| Richmond Shire Council | 0.0 | 0.0 | 0.0 | September 2026 only |
| Rockhampton Regional Council | 38.2 | 48.6 | 35.9 | September 2026 only |
| Scenic Rim Regional Council | 6.3 | 14.6 | 16.7 | September 2026 only |
| Somerset Regional Council | 18.3 | 25.6 | 32.9 | September 2026 only |
| South Burnett Regional Council | 28.1 | 30.9 | 25.3 | September 2026 only |
| Southern Downs Regional Council | 13.0 | 15.6 | 20.8 | September 2026 only |
| Sunshine Coast Regional Council | 14.4 | 11.3 | 26.2 | September 2026 only |
| Tablelands Regional Council | 21.3 | 7.1 | 24.8 | September 2026 only |
| Toowoomba Regional Council | 28.6 | 17.5 | 42.4 | September 2026 only |
| Torres Shire Council | 0.0 | 0.0 | 28.6 | September 2026 only |
| Torres Strait Island Regional Council | 23.2 | 0.0 | 0.0 | September 2026 only |
| Townsville City Council | 95.9 | 56.6 | 59.0 | September 2026 only |
| Weipa (T) | 23.1 | 0.0 | 0.0 | September 2026 only |
| Western Downs Regional Council | 5.6 | 19.6 | 28.0 | September 2026 only |
| Whitsunday Regional Council | 14.2 | 16.6 | 28.5 | September 2026 only |
| Winton Shire Council | 0.0 | 0.0 | 85.8 | September 2026 only |
| Woorabinda Shire Council | 91.7 | 91.7 | 0.0 | September 2026 only |
| Wujal Wujal Shire Council | 0.0 | 327.8 | 0.0 | September 2026 only |
| Yarrabah Shire Council | 149.0 | 111.8 | 0.0 | September 2026 only |
Source: QPS LGA Reported Offences Rates CSV, linked from Maps and statistics. The dwelling-entry label in the table abbreviates “Unlawful Entry With Intent - Dwelling”; it does not include every form of unlawful entry to shops or other premises. The vehicle categories also retain their own meanings.
The table shows LGAs rather than police districts or suburbs. Those boundaries should not be swapped without checking the geography. A suburb can be only part of a large council area, and an LGA average cannot show the different circumstances around a shopping precinct, rural shed, apartment building or quiet residential street.
Why is this a monthly snapshot rather than an annual table?
The available QPS LGA rates download contains monthly observations, not a ready-made annual-rate column. The latest complete month in the file archived on 27 October 2026 is September 2026; this remains a dated snapshot rather than a live feed. We show that month explicitly instead of presenting an unsupported financial-year rate or estimating one from population figures inferred from the monthly cells.
QPS advises care when comparing individual months because seasonal differences can affect the figures. A longer series is generally more useful for a stable comparison. This page offers a transparent current snapshot, but it cannot answer whether an LGA had the highest rate across the whole financial year.
Do not multiply one month’s rate to make a yearly forecast. Nor should rates from different months be silently added and described as an official QPS annual rate: population denominators and revisions need to be established first. Use a verified annual publication for an annual claim and retain this table’s month label wherever you quote it.
Download this month or look up an annual report
Download the 78 displayed September 2026 rows (CSV). These are this page’s rounded values, copied from the QPS file archived on 27 October 2026. For reproduction, filter the original CSV’s period field to SEP26, retain every LGA row and select the three named offence columns. Ignore the trailing unnamed record identifier; it is not an offence rate.
For a full-year question, use QGSO’s official Crime report, Queensland. The current report listed when checked on 6 November 2026 covers 2024–25 and was published on 7 April 2026. Check its geography and offence definitions: an annual statewide result is not an annual version of this LGA snapshot.
Daniel Tang maintains this guide. A future monthly update requires checking the new QPS file and its metadata, preserving the selected month, reviewing any revisions and regenerating the matching CSV. The monthly rate file does not identify the population vintage for each cell, so this guide does not invent a denominator or combine monthly rates into an annual claim.
Can you compare this with Victoria and NSW?
No direct annual comparison is supported. Queensland’s table covers September 2026; the NSW guide covers the year ending June 2026, and Victoria’s suburb table contains counts rather than rates. Even a matching period would still require attention to offence definitions, counting rules and the population used by each agency.
QGSO explains that different counting rules can produce different statistics from the same criminal-justice information. Reporting practices, detection and changes in the law can also affect trends. A change in a recorded rate therefore does not automatically mean the same change in all crime occurring in the community.
If you are comparing homes across state borders, keep the original sources beside your notes and separate the statistical question from the property inspection. A monthly statewide league table assembled from unrelated figures would hide the limits that matter. The visible period and category labels are part of the evidence, not optional decoration.
What do the numbers mean for your home?
The most useful outcome is a focused inspection of the property, rather than a label attached to its council. Look at dwelling access, parking and the routes between them. Check whether doors lock reliably, whether tools or valuables are visible, and whether keys and garage remotes can be reached or seen from outside.
For a detached shed or carport, think about what happens before someone reaches the stored property. Lighting, clear sightlines, maintained locks and a neighbour who recognises the usual routine can each address a different gap. The shed alarm guide explains how an audible layer can fit beside physical protection.
For an apartment or shared driveway, agree who controls the common gate, who reports a fault and how delivery access works. A local sound cue inside one dwelling cannot secure the shared building. Our garage security guide can help separate a private entry from an access issue that belongs to building management.
The rates file does not evaluate alarm products or prove that a particular device changes an area’s crime. Choose equipment for a defined role and test it at your property. Treat deterrence, detection, recording and emergency response as different functions, and avoid assuming any one layer provides all of them.
Turn the area check into a home check
- Do: Inspect the home’s locks and the route from the carport to the door. Do not: Treat September’s monthly figure as an annual probability for the household.
- Do: Keep tools, car keys and garage remotes secured and out of sight. Do not: Read the vehicle-entry column as a count of stolen vehicles.
- Do: Use a sheltered mounting position for a compatible outdoor sensor. Do not: Place a sheltered-only sensor in an exposed Queensland downpour.
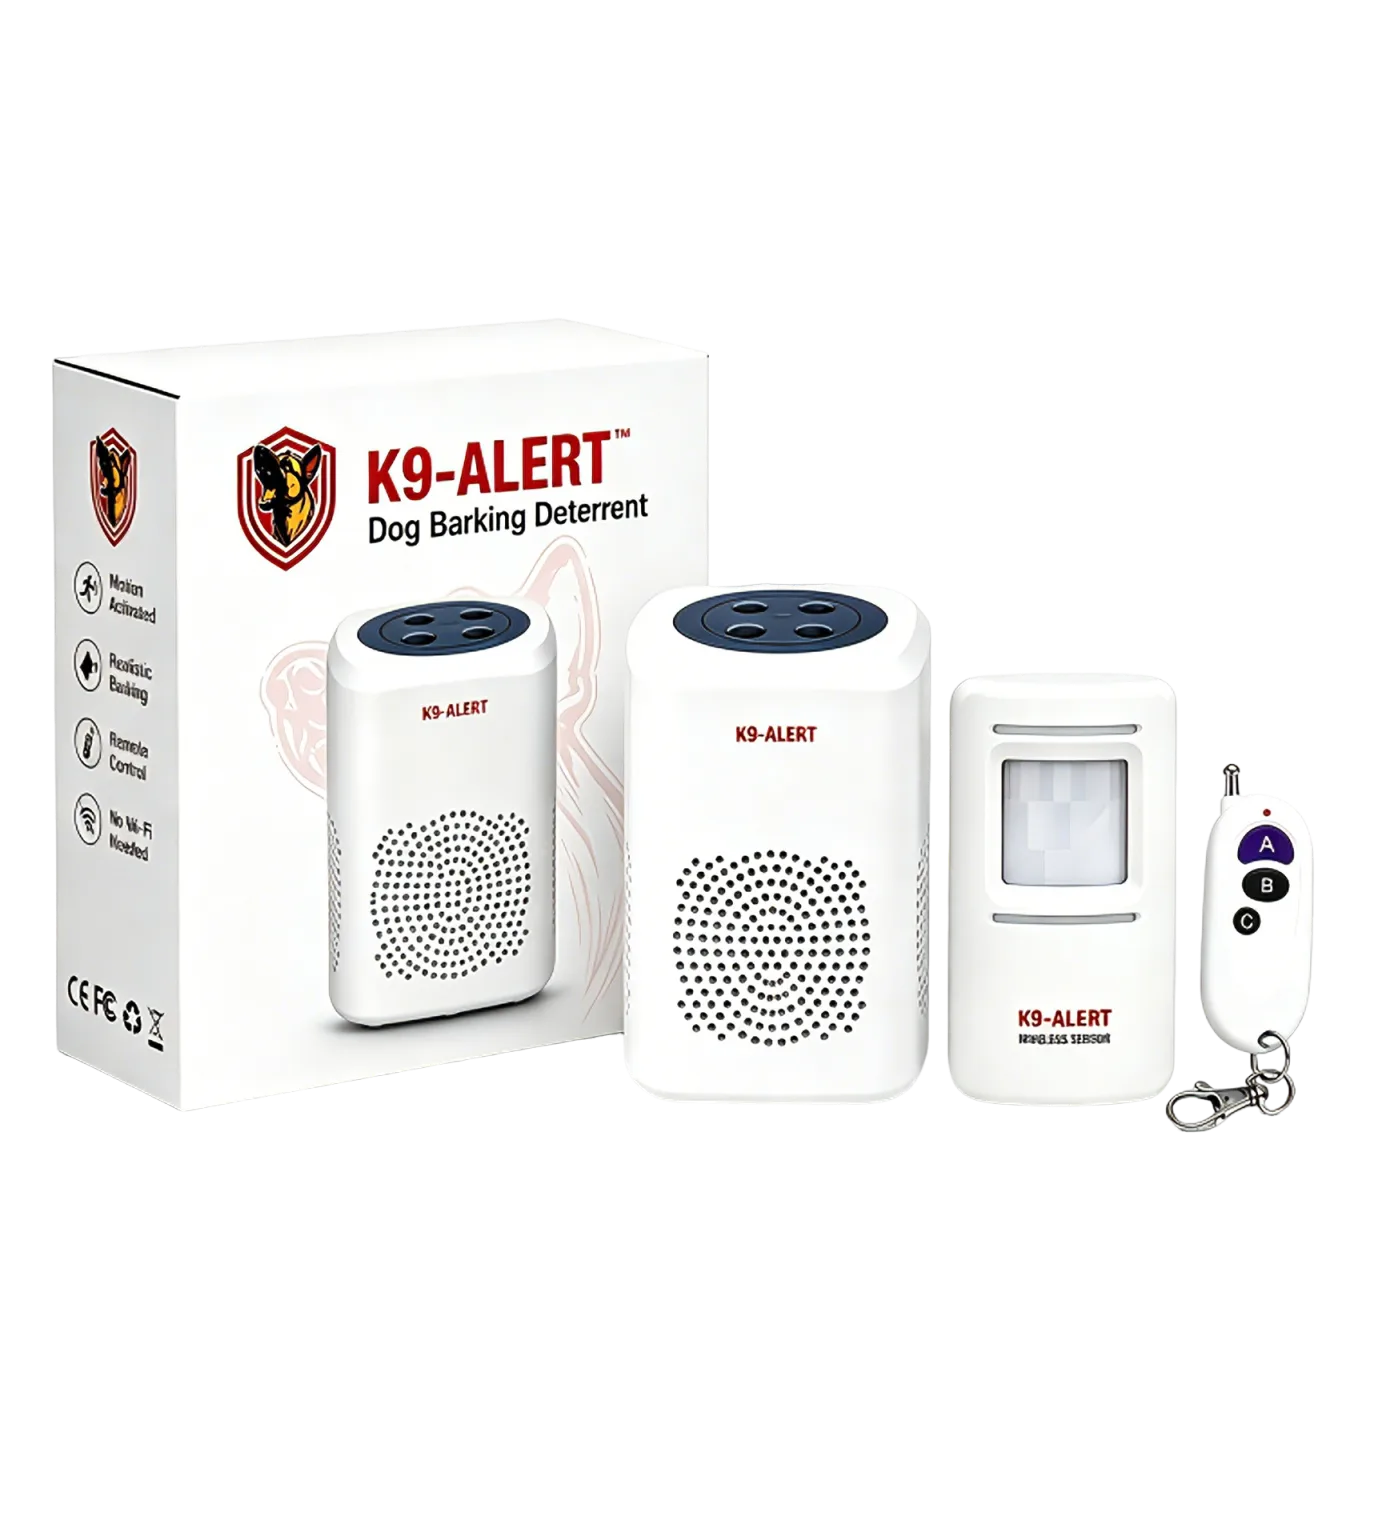
Where K9-Alert fits
K9-Alert can add a motion-triggered sound layer at a sheltered porch, carport or shed approach without Wi-Fi or an app. Keep the sensor under an eave, porch or carport rather than exposed outdoors. It complements locks and lighting; it does not provide a monitored response, identify a person or turn a monthly council rate into a household risk assessment.
Watch the approach-sound demonstration · View kit details and placement limitsCheck the approach before choosing a sound layer
If an audible cue suits your entry, review the placement and device limits before ordering. Keep physical security and a safe response plan in place.
View K9-Alert ordering optionsFrequently asked questions
Are these Queensland crime rates annual?
No. Every Queensland rate on this page is a monthly rate for September 2026 from the official QPS LGA rates file. It is not a financial-year total or a yearly forecast. Keep the month with any quoted value and do not compare it directly with an annual rate from another state.
Which Queensland area has the highest dwelling-entry rate here?
Doomadgee Shire Council has the highest published rate for Unlawful Entry With Intent - Dwelling in the September 2026 snapshot used here. That is one offence category over one month, including small-population councils. It is not an official annual comparison or a prediction about a particular home or resident.
Does a zero rate mean there is no crime risk?
No. A published zero means the file reports a zero rate for that selected offence category in that month. It does not describe every offence or every unreported event, and it does not predict next month. Review the building’s access points and household routine independently of the table value.
Can I compare Queensland with the NSW table?
Not directly. This Queensland page shows monthly QPS reported-offence rates, while the NSW page shows annual BOCSAR recorded-incident rates. Their categories and counting methods also differ. Use matching periods and official definitions for a valid comparison rather than multiplying a monthly value into an assumed annual rate.
Sources
About this guide: The original monthly file was archived on 27 October 2026. Daniel Tang checked the source guidance, downloadable snapshot and official annual-report route for this update on 6 November 2026. This is general education, not emergency, legal or insurance advice. Recorded crime is subject to reporting, classification and revision; consult the publishing agency for decisions requiring the latest official record.
- Queensland Police Service Maps and statistics — official LGA download link and interpretation caution
- Queensland Government Open Data — LGA rates dataset and CC BY 4.0 metadata
- Queensland Government Statistician’s Office — interpretation, resident population and counting rules
Data attribution: Queensland Police Service; reused under Creative Commons Attribution 4.0. Tables retain the stated period and published category scope.