
TL;DR: Compare NSW councils using the same offence category and annual period. BOCSAR’s year ending June 2026 table ranks Moree Plains first for dwelling break and enter among eligible LGAs. Rates use resident population; small-population exclusions and visitor effects mean a council comparison is context, not a prediction for your address.

How is the NSW crime rate by area calculated?
BOCSAR publishes annual incidents per 100,000 residents using population data supplied by the Australian Bureau of Statistics. The calculation is recorded incidents divided by the relevant resident population, multiplied by 100,000. This page copies the official rates for July 2025 to June 2026; it does not create a new population estimate.
The official LGA comparison files include counts, rates and ranks. Rates are not calculated for very small LGAs under BOCSAR’s published population rule. The workbook marks those cells “nc”, which means not calculated. We retain that label and do not use a count to invent a missing rate.
To turn an area check into an entry review, use the garage alarm system guide for an attached garage or a car stored under cover. Check the door, remote and route into the house as separate issues. An area average cannot show whether those access points are secure.
The denominator is residents, rather than the people present during a busy day. Sydney LGA has published rates but is excluded from BOCSAR’s rate rankings because of visitor effects. Keep that distinction when comparing it with suburban councils; do not silently assign Sydney a rank that the publisher chose not to calculate.
Counts, rates and the source version
Download the 130 displayed geographic rows (CSV). The source is BOCSAR’s offence-type workbook, archived on 27 October 2026 for the release dated 16 September 2026. The CSV retains this page’s rounded rates and “nc”; use the workbook for original precision and counts.
Open each named offence sheet. Columns AC, AD and AE give the year ending June 2026 count, rate and rank. Columns Z, AA and AB give the matching preceding year. A count is recorded incidents; a rate scales that count by BOCSAR’s resident-population denominator. Do not reverse-calculate an assumed population from rounded values or treat a council as a suburb.
For the denominator and exclusions, read BOCSAR’s population-rate explanations. Keep the same geography and category for any comparison. Daniel Tang maintains this guide; a new BOCSAR release or correction requires checking the source version, geography and downloadable rows together.
How do matching NSW annual figures compare?
| Category | 2024–25 count | 2025–26 count | 2024–25 rate per 100,000 | 2025–26 rate per 100,000 |
|---|---|---|---|---|
| Break and enter dwelling | 18,367 | 17,941 | 216.6 | 211.6 |
| Motor vehicle theft | 14,875 | 14,661 | 175.4 | 172.9 |
| Steal from motor vehicle | 25,353 | 24,593 | 299.0 | 290.0 |
Each period is July to June. These published statewide figures provide context, not a trend for every LGA or a prediction for an address. Differences here are descriptive; no statistical-significance test or cause is claimed. Source workbooks can be revised, so record the download date when repeating this comparison.
Which areas have the highest rates?
The answer changes with the offence. In BOCSAR’s eligible annual LGA rankings, Moree Plains leads dwelling break and enter, while Gunnedah leads both motor vehicle theft and stealing from vehicles. These are category-specific results for the year ending June 2026, not a combined “most dangerous area” score.
| Offence | LGA | Annual rate per 100,000 |
|---|---|---|
| Break and enter dwelling | Moree Plains | 1,669.8 |
| Motor vehicle theft | Gunnedah | 679.5 |
| Steal from motor vehicle | Gunnedah | 1,142.5 |
Source: BOCSAR LGA comparison by Offence Type, the selected offence sheets, latest annual columns. The heading above follows the publisher’s rank rather than sorting suppressed rates or adding categories together. A lower position in one category does not establish a lower rate in another, and it does not measure an offender’s intent.
Check your NSW council
Search the table by LGA name to find the official annual rates for dwelling break and enter, motor vehicle theft and stealing from motor vehicles. All geographic rows from the selected comparison sheets are retained, including areas with no calculated rate. Values are displayed to one decimal place; the original workbook retains the full precision.
Worked lookup: Ballina
Enter Ballina below and read across the LGA row, keeping the offence-column heading in view. Its dwelling break-and-enter rate is 327.5 per 100,000 residents for the year ending June 2026, rounded from the BOCSAR offence-type workbook. This is an annual population rate, not 327.5 incidents or a household percentage.
For the underlying count, open the workbook’s Break and enter dwelling sheet and read Ballina’s latest-year count and rate together, using the columns described above. Save the LGA, offence, annual period and unit with the result; a screenshot showing only “327.5” loses the information needed to interpret it.
All 130 rows shown. All rows remain available without JavaScript.
| LGA | Break and enter dwelling: rate per 100,000 | Motor vehicle theft: rate per 100,000 | Steal from motor vehicle: rate per 100,000 | Period |
|---|---|---|---|---|
| Albury | 413.3 | 363.5 | 797.4 | Year ending June 2026 |
| Armidale | 725.2 | 188.9 | 333.9 | Year ending June 2026 |
| Ballina | 327.5 | 217.0 | 335.9 | Year ending June 2026 |
| Balranald | nc | nc | nc | Year ending June 2026 |
| Bathurst | 215.8 | 175.8 | 238.1 | Year ending June 2026 |
| Bayside | 106.0 | 141.5 | 257.7 | Year ending June 2026 |
| Bega Valley | 106.6 | 147.6 | 144.8 | Year ending June 2026 |
| Bellingen | 203.3 | 150.6 | 278.7 | Year ending June 2026 |
| Berrigan | 150.0 | 265.4 | 196.2 | Year ending June 2026 |
| Blacktown | 162.0 | 161.3 | 264.6 | Year ending June 2026 |
| Bland | 110.0 | 183.4 | 275.0 | Year ending June 2026 |
| Blayney | 218.9 | 128.7 | 154.5 | Year ending June 2026 |
| Blue Mountains | 97.6 | 49.4 | 131.8 | Year ending June 2026 |
| Bogan | nc | nc | nc | Year ending June 2026 |
| Bourke | nc | nc | nc | Year ending June 2026 |
| Brewarrina | nc | nc | nc | Year ending June 2026 |
| Broken Hill | 570.1 | 193.8 | 496.0 | Year ending June 2026 |
| Burwood | 154.6 | 120.0 | 209.9 | Year ending June 2026 |
| Byron | 251.2 | 259.1 | 489.1 | Year ending June 2026 |
| Cabonne | 115.1 | 129.5 | 115.1 | Year ending June 2026 |
| Camden | 50.3 | 104.9 | 139.6 | Year ending June 2026 |
| Campbelltown | 156.1 | 162.5 | 343.1 | Year ending June 2026 |
| Canada Bay | 195.1 | 132.2 | 242.8 | Year ending June 2026 |
| Canterbury-Bankstown | 115.5 | 155.5 | 278.8 | Year ending June 2026 |
| Carrathool | nc | nc | nc | Year ending June 2026 |
| Central Coast | 228.6 | 162.1 | 301.0 | Year ending June 2026 |
| Central Darling | nc | nc | nc | Year ending June 2026 |
| Cessnock | 346.1 | 547.9 | 389.3 | Year ending June 2026 |
| Clarence Valley | 508.6 | 335.5 | 364.0 | Year ending June 2026 |
| Cobar | 298.9 | 597.8 | 622.7 | Year ending June 2026 |
| Coffs Harbour | 305.2 | 235.1 | 403.7 | Year ending June 2026 |
| Coolamon | 216.8 | 216.8 | 130.1 | Year ending June 2026 |
| Coonamble | 542.5 | 516.7 | 594.2 | Year ending June 2026 |
| Cootamundra-Gundagai | 253.9 | 148.8 | 236.3 | Year ending June 2026 |
| Cowra | 315.5 | 252.4 | 418.0 | Year ending June 2026 |
| Cumberland | 160.1 | 176.7 | 355.8 | Year ending June 2026 |
| Dubbo | 598.3 | 284.2 | 422.8 | Year ending June 2026 |
| Dungog | 30.3 | 121.2 | 141.3 | Year ending June 2026 |
| Edward River | 321.0 | 118.9 | 225.9 | Year ending June 2026 |
| Eurobodalla | 238.2 | 162.9 | 204.2 | Year ending June 2026 |
| Fairfield | 90.0 | 118.3 | 267.2 | Year ending June 2026 |
| Federation | 107.1 | 114.7 | 206.5 | Year ending June 2026 |
| Forbes | 484.1 | 258.2 | 548.7 | Year ending June 2026 |
| Georges River | 116.3 | 85.4 | 155.3 | Year ending June 2026 |
| Gilgandra | 534.3 | 394.9 | 743.3 | Year ending June 2026 |
| Glen Innes Severn | 490.1 | 311.9 | 289.6 | Year ending June 2026 |
| Goulburn Mulwaree | 202.3 | 187.2 | 341.3 | Year ending June 2026 |
| Greater Hume | 103.6 | 189.9 | 189.9 | Year ending June 2026 |
| Griffith | 336.5 | 274.3 | 325.5 | Year ending June 2026 |
| Gunnedah | 649.6 | 679.5 | 1,142.5 | Year ending June 2026 |
| Gwydir | 408.7 | 286.1 | 224.8 | Year ending June 2026 |
| Hawkesbury | 126.6 | 161.6 | 161.6 | Year ending June 2026 |
| Hay | nc | nc | nc | Year ending June 2026 |
| Hilltops | 181.3 | 98.4 | 124.4 | Year ending June 2026 |
| Hornsby | 67.8 | 38.8 | 101.4 | Year ending June 2026 |
| Hunters Hill | 241.8 | 85.3 | 192.0 | Year ending June 2026 |
| Inner West | 190.6 | 191.2 | 279.1 | Year ending June 2026 |
| Inverell | 492.3 | 193.6 | 320.8 | Year ending June 2026 |
| Junee | 77.4 | 139.4 | 92.9 | Year ending June 2026 |
| Kempsey | 652.6 | 454.0 | 435.1 | Year ending June 2026 |
| Kiama | 129.5 | 129.5 | 168.3 | Year ending June 2026 |
| Ku-ring-gai | 64.7 | 17.9 | 69.3 | Year ending June 2026 |
| Kyogle | 219.2 | 146.1 | 198.3 | Year ending June 2026 |
| Lachlan | 490.8 | 474.4 | 539.8 | Year ending June 2026 |
| Lake Macquarie | 204.2 | 221.3 | 376.8 | Year ending June 2026 |
| Lane Cove | 148.0 | 61.1 | 124.5 | Year ending June 2026 |
| Leeton | 507.1 | 367.2 | 323.5 | Year ending June 2026 |
| Lismore | 422.5 | 278.6 | 376.9 | Year ending June 2026 |
| Lithgow | 217.0 | 231.4 | 236.3 | Year ending June 2026 |
| Liverpool | 163.6 | 171.8 | 292.7 | Year ending June 2026 |
| Liverpool Plains | 221.6 | 234.7 | 221.6 | Year ending June 2026 |
| Lockhart | 287.9 | 259.1 | 259.1 | Year ending June 2026 |
| Lord Howe Island | nc | nc | nc | Year ending June 2026 |
| Maitland | 306.6 | 312.7 | 409.5 | Year ending June 2026 |
| Mid-Coast | 378.4 | 226.2 | 284.0 | Year ending June 2026 |
| Mid-Western | 167.8 | 125.9 | 125.9 | Year ending June 2026 |
| Moree Plains | 1,669.8 | 491.6 | 694.4 | Year ending June 2026 |
| Mosman | 140.2 | 92.3 | 143.6 | Year ending June 2026 |
| Murray River | 346.6 | 309.7 | 435.0 | Year ending June 2026 |
| Murrumbidgee | 218.7 | 382.7 | 410.1 | Year ending June 2026 |
| Muswellbrook | 434.1 | 237.9 | 297.3 | Year ending June 2026 |
| Nambucca Valley | 309.7 | 376.4 | 543.2 | Year ending June 2026 |
| Narrabri | 484.5 | 336.0 | 484.5 | Year ending June 2026 |
| Narrandera | 422.0 | 351.7 | 474.8 | Year ending June 2026 |
| Narromine | 435.3 | 482.0 | 513.1 | Year ending June 2026 |
| Newcastle | 523.6 | 424.6 | 883.2 | Year ending June 2026 |
| North Sydney | 109.7 | 71.3 | 142.6 | Year ending June 2026 |
| Northern Beaches | 62.0 | 72.0 | 128.2 | Year ending June 2026 |
| Oberon | 71.4 | 107.1 | 89.2 | Year ending June 2026 |
| Orange | 576.1 | 300.4 | 645.6 | Year ending June 2026 |
| Parkes | 386.3 | 266.9 | 295.0 | Year ending June 2026 |
| Parramatta | 240.4 | 140.0 | 341.5 | Year ending June 2026 |
| Penrith | 202.5 | 194.6 | 355.1 | Year ending June 2026 |
| Port Macquarie-Hastings | 249.9 | 156.3 | 260.9 | Year ending June 2026 |
| Port Stephens | 164.8 | 220.5 | 334.6 | Year ending June 2026 |
| Queanbeyan-Palerang | 152.6 | 109.2 | 130.1 | Year ending June 2026 |
| Randwick | 226.1 | 189.5 | 266.9 | Year ending June 2026 |
| Richmond Valley | 640.4 | 385.1 | 343.2 | Year ending June 2026 |
| Ryde | 154.6 | 69.8 | 207.1 | Year ending June 2026 |
| Shellharbour | 180.2 | 147.1 | 244.0 | Year ending June 2026 |
| Shoalhaven | 254.5 | 186.8 | 296.9 | Year ending June 2026 |
| Singleton | 273.0 | 195.0 | 241.8 | Year ending June 2026 |
| Snowy Monaro | 121.1 | 67.3 | 98.7 | Year ending June 2026 |
| Snowy Valleys | 274.2 | 153.8 | 407.9 | Year ending June 2026 |
| Strathfield | 237.1 | 247.4 | 373.2 | Year ending June 2026 |
| Sutherland | 74.6 | 45.7 | 100.2 | Year ending June 2026 |
| Sydney | 281.5 | 284.5 | 363.3 | Year ending June 2026 |
| Tamworth | 781.4 | 380.8 | 562.9 | Year ending June 2026 |
| Temora | 215.8 | 116.2 | 282.3 | Year ending June 2026 |
| Tenterfield | 536.6 | 381.3 | 296.6 | Year ending June 2026 |
| The Hills | 78.8 | 50.1 | 109.5 | Year ending June 2026 |
| Tweed | 200.4 | 206.4 | 397.8 | Year ending June 2026 |
| Unincorporated Far West | nc | nc | nc | Year ending June 2026 |
| Upper Hunter | 194.3 | 194.3 | 249.9 | Year ending June 2026 |
| Upper Lachlan | 112.7 | 90.1 | 191.5 | Year ending June 2026 |
| Uralla | 196.9 | 147.6 | 262.5 | Year ending June 2026 |
| Wagga Wagga | 571.4 | 256.7 | 651.2 | Year ending June 2026 |
| Walcha | nc | nc | nc | Year ending June 2026 |
| Walgett | 1,582.7 | 400.2 | 982.4 | Year ending June 2026 |
| Warren | nc | nc | nc | Year ending June 2026 |
| Warrumbungle | 432.9 | 216.5 | 151.5 | Year ending June 2026 |
| Waverley | 129.0 | 168.8 | 138.6 | Year ending June 2026 |
| Weddin | 110.9 | 110.9 | 166.3 | Year ending June 2026 |
| Wentworth | 653.5 | 410.0 | 486.9 | Year ending June 2026 |
| Willoughby | 121.8 | 50.2 | 153.2 | Year ending June 2026 |
| Wingecarribee | 63.5 | 61.6 | 95.2 | Year ending June 2026 |
| Wollondilly | 60.2 | 107.1 | 115.4 | Year ending June 2026 |
| Wollongong | 206.9 | 164.5 | 338.9 | Year ending June 2026 |
| Woollahra | 128.7 | 116.0 | 197.6 | Year ending June 2026 |
| Yass Valley | 73.7 | 96.3 | 62.3 | Year ending June 2026 |
Source: BOCSAR original offence-type comparison workbook. “nc” is not zero. The table describes councils, not suburbs within those councils. If your suburb is unfamiliar to the search, check which local government area it belongs to rather than treating an absent suburb name as absent crime.
The statewide annual rates in the same workbook are 211.6 for break and enter dwelling, 172.9 for motor vehicle theft, 290.0 for steal from motor vehicle. Statewide totals exclude incidents in correctional facilities as explained in the file. Keep the state benchmark separate from a comparison of individual councils.
Which offences matter when checking a home?
Dwelling break and enter is the closest selected category to a home break-in. Motor vehicle theft and stealing from a vehicle describe different events: losing the vehicle and having property stolen from it. Read these columns separately so that a busy parking area does not become a claim about burglaries inside nearby dwellings.
BOCSAR’s definitions and explanations set out the counting rules. Recorded incidents are police data, not convictions, unique offenders or a complete measure of unreported crime. The selected columns do not describe all security concerns, and they cannot indicate whether a particular garage, gate or window was involved.
A sensible property inspection follows the distinction in the data. Check the condition of doors and windows for dwelling access; check locks, visible contents and parking visibility for the car. Then check how a garage remote or car key could connect those spaces. Our home burglary and car key guide covers that connection in more detail.
Can you compare NSW with Victoria or Queensland?
Not directly from these tables. NSW uses recorded incidents within its offence definitions, Victoria’s suburb table uses recorded offence counts, and the Queensland page shows a single month’s official rates. Differences in periods, category definitions, counting rules and population methods mean the numbers do not form a consistent interstate league table.
Within NSW, use one category and one annual period first. BOCSAR notes that rates for the latest year can use the previous population estimate when newer estimates are unavailable. A change in the rate can therefore reflect the numerator, the population base or revisions; it is not evidence by itself that a home security measure worked.
For Victoria, the council table and suburb counts answer different questions even within the same state. For Queensland, a monthly figure is not an annual figure divided into a convenient comparison. Keep a note of the reporting period with any saved result, including when sharing a figure with a property manager or neighbour.
What do the numbers mean for your home?
Use the figures to plan questions, then inspect the home itself. A council’s rate cannot show an unlocked laundry door, visible keys or a garage remote left in a parked car. Those details can be checked directly. Start with access control and daily habits before deciding whether a further detection or deterrence layer is useful.
For renters, photograph maintenance concerns and ask the agent about damaged locks, window latches and garage access. For owners, check whether household members use the same routine for securing shared entrances. Avoid promising that a particular change will reduce risk by a percentage: these area files contain no evidence that could support such a product claim.
A camera can record an event, an audible cue can make an approach noticeable, and a lock can resist entry. These functions complement one another, but none turns a postcode into a guarantee. The driveway sensor guide helps distinguish an approach alert from a system that records evidence or sends notifications.
Turn the area check into a home check
- Do: Check dwelling access and the internal garage door after reading the burglary column. Do not: Use the vehicle-theft rate as a substitute for a dwelling-burglary rate.
- Do: Store remotes and keys inside, out of sight from the entry. Do not: Leave a working garage remote in a vehicle parked outside.
- Do: Discuss faulty locks and shared access with the owner or property manager. Do not: Assume the council average describes the security of a particular rental.
Where K9-Alert fits
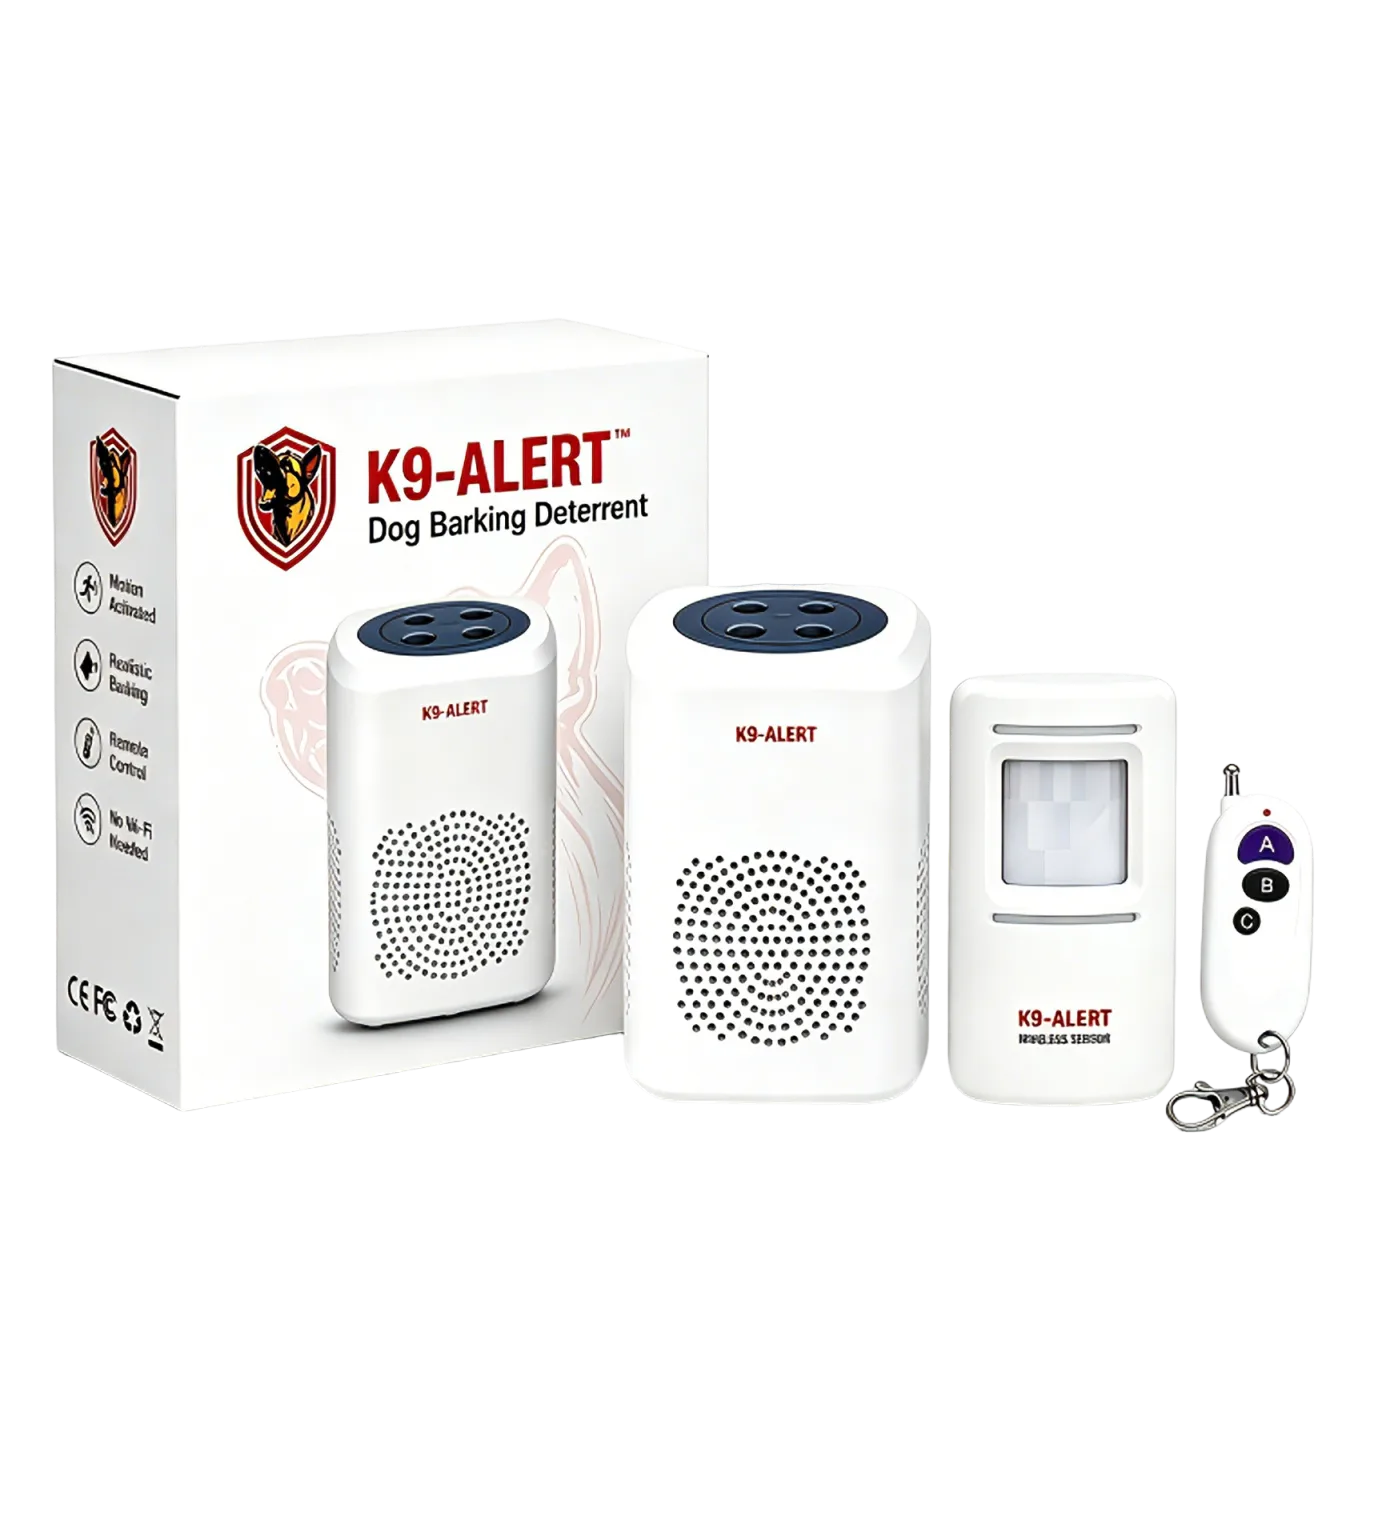
Where a quiet garage or porch approach needs a local sound cue, K9-Alert can add an audible deterrent layer without Wi-Fi or an app. Its sensor must be sheltered outdoors under an eave, porch or carport. It complements secure doors and sensible key storage; it does not record video or provide police response.
Watch the approach-sound demonstration · View kit details and placement limitsCheck the approach before choosing a sound layer
If an audible cue suits your entry, review the placement and device limits before ordering. Keep physical security and a safe response plan in place.
View K9-Alert ordering optionsFrequently asked questions
What period does this NSW crime table cover?
The table covers July 2025 to June 2026, the year ending June 2026. Its rates come from BOCSAR’s official LGA comparison workbook released in September 2026. Each rate refers to a selected offence category over that annual period, rather than to a single month or a prediction for next year.
Which NSW area has the highest dwelling break-in rate?
Moree Plains has the highest eligible BOCSAR rank for break and enter dwelling in the year ending June 2026. The comparison excludes areas under the publisher’s population rules and excludes Sydney from rate rankings because of visitor effects. It should not be read as a comparison of individual suburbs or streets.
What does nc mean in the NSW table?
It means the publisher has not calculated a rate. BOCSAR applies population rules because rates for small areas can change sharply with a small number of incidents. We retain the original nc label rather than replacing it with zero, estimating a population or assigning the area a place in the rankings.
Can NSW annual rates be compared with Queensland monthly rates?
No. They cover different reporting periods and use different offence definitions and recording systems. A monthly rate should not be treated as an annual rate, and multiplying it does not create a verified annual result. Compare areas within the same official series, category and period before looking at differences between states.
Sources
About this guide: The original files were archived on 27 October 2026. Daniel Tang checked the source guidance, reproduction notes and matching annual comparison for this update on 6 November 2026. This is general education, not emergency, legal or insurance advice. Recorded crime is subject to reporting, classification and revision; consult the publishing agency for decisions requiring the latest official record.
- BOCSAR Local area rankings — release period, original violent/property and offence-type workbooks
- BOCSAR Crime statistics by LGA — NSW and Sydney original recorded-crime workbooks
- BOCSAR Definitions and explanations — counting rules and population rates
Data attribution: NSW Bureau of Crime Statistics and Research; reused under Creative Commons Attribution 4.0. Tables retain the stated period and published category scope.